

Ola Kowalczyk
-
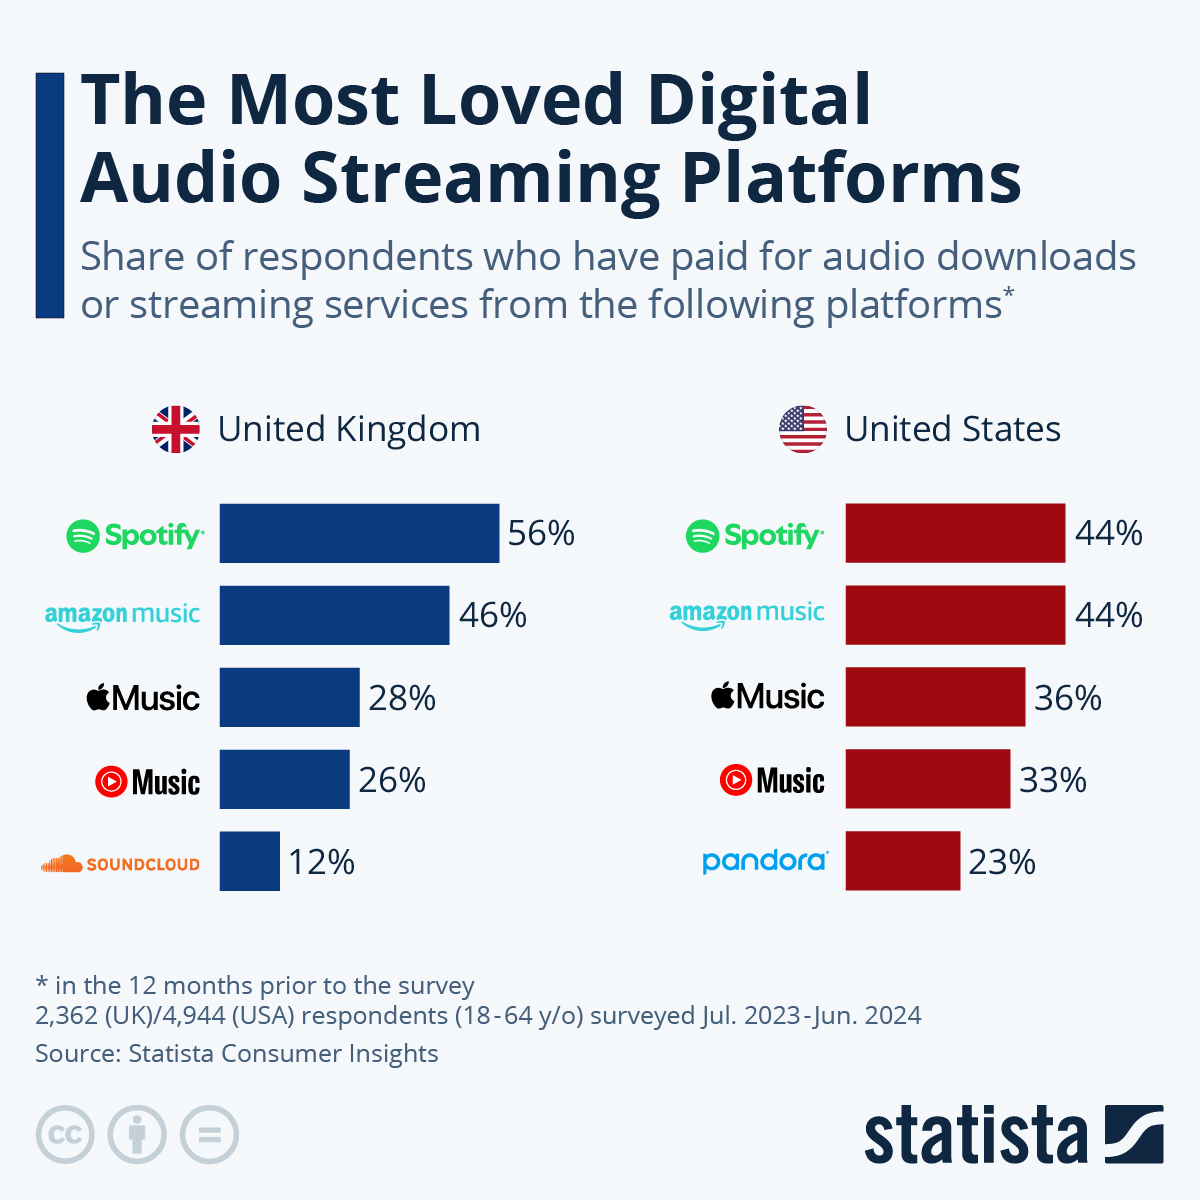
Most popular audio streaming platforms: UK vs. US comparison
Spotify is a leading platform in both the United Kingdom and United States. It’s followed by Amazon Music and Apple Music.
-

45 most famous phones from pop culture (infographic)
The new infographic puts together the most recognizable phones used in Hollywood movies, creating a fascinating evolution of mobile technology.
-

Explainer: 9 major types of copywriting
Understanding the nuances of different copywriting styles will empower you to tailor your message to specific audiences and achieve your goals more effectively.
-

8 most common writing errors that make you look unprofessional (infographic)
Many people, professionals among them, make common writing errors that can damage their reputation.
-
Turning your blog posts into infographics (tips)
Do you consider using infographics to boost your most valuable blog articles? Check out these quick and simple tips.
-

9 main benefits of learning a second language
Learning a second language is a rewarding experience that can offer a number of benefits. This infographic lists the main ones.
-

The difference between content writing and copywriting (infographic)
Copywriting and content writing are two different types of writing that serve different purposes.
-
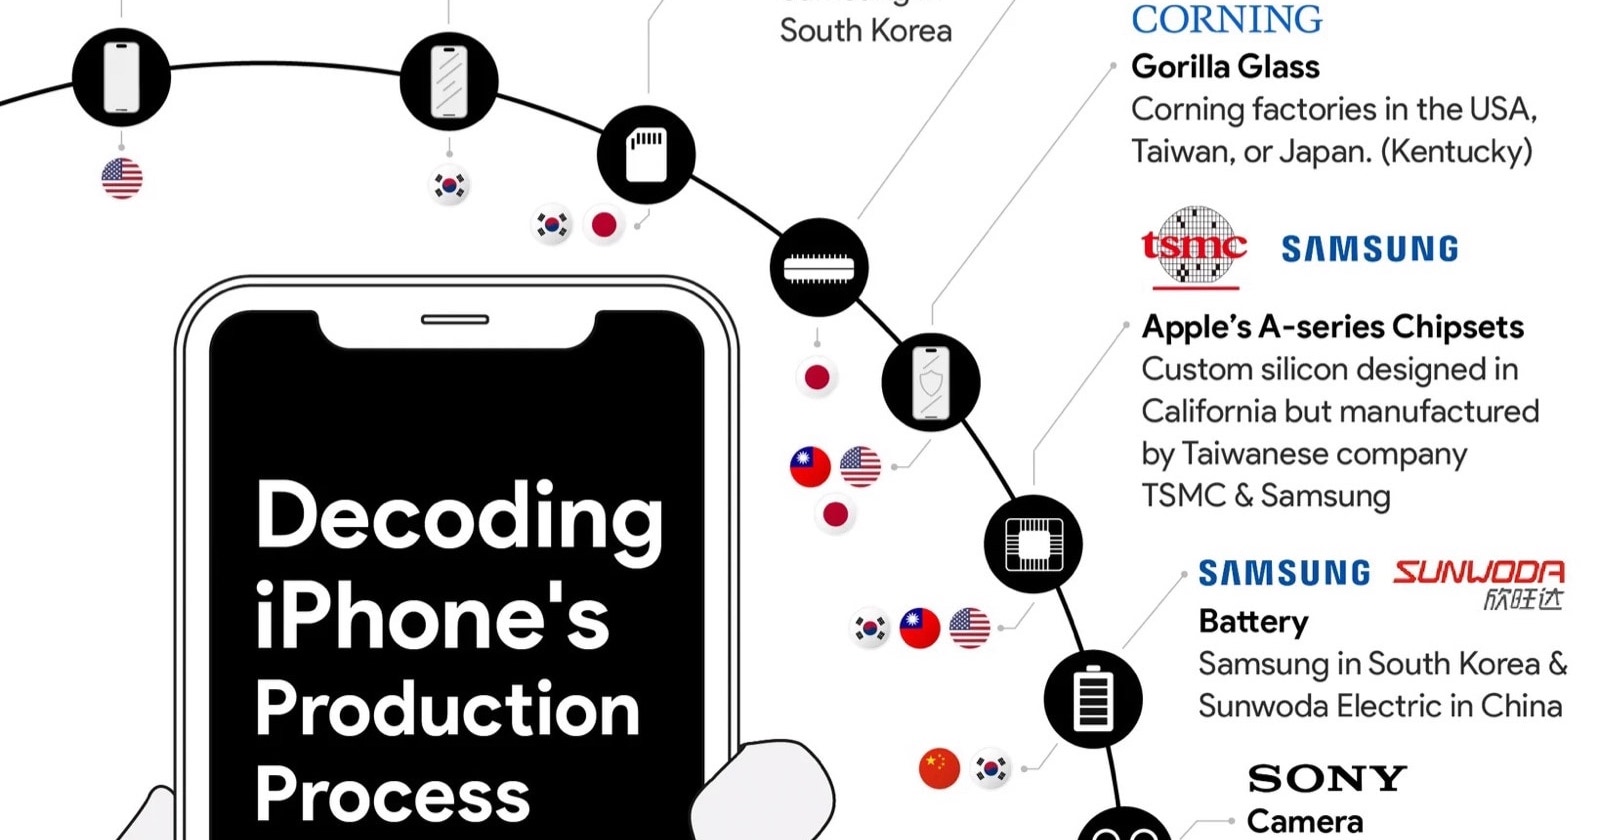
Where is the iPhone made? (chart)
From design to assembly, the iPhone is a product of many hands, in the USA, China, South Korea, Taiwan, and Japan.
-
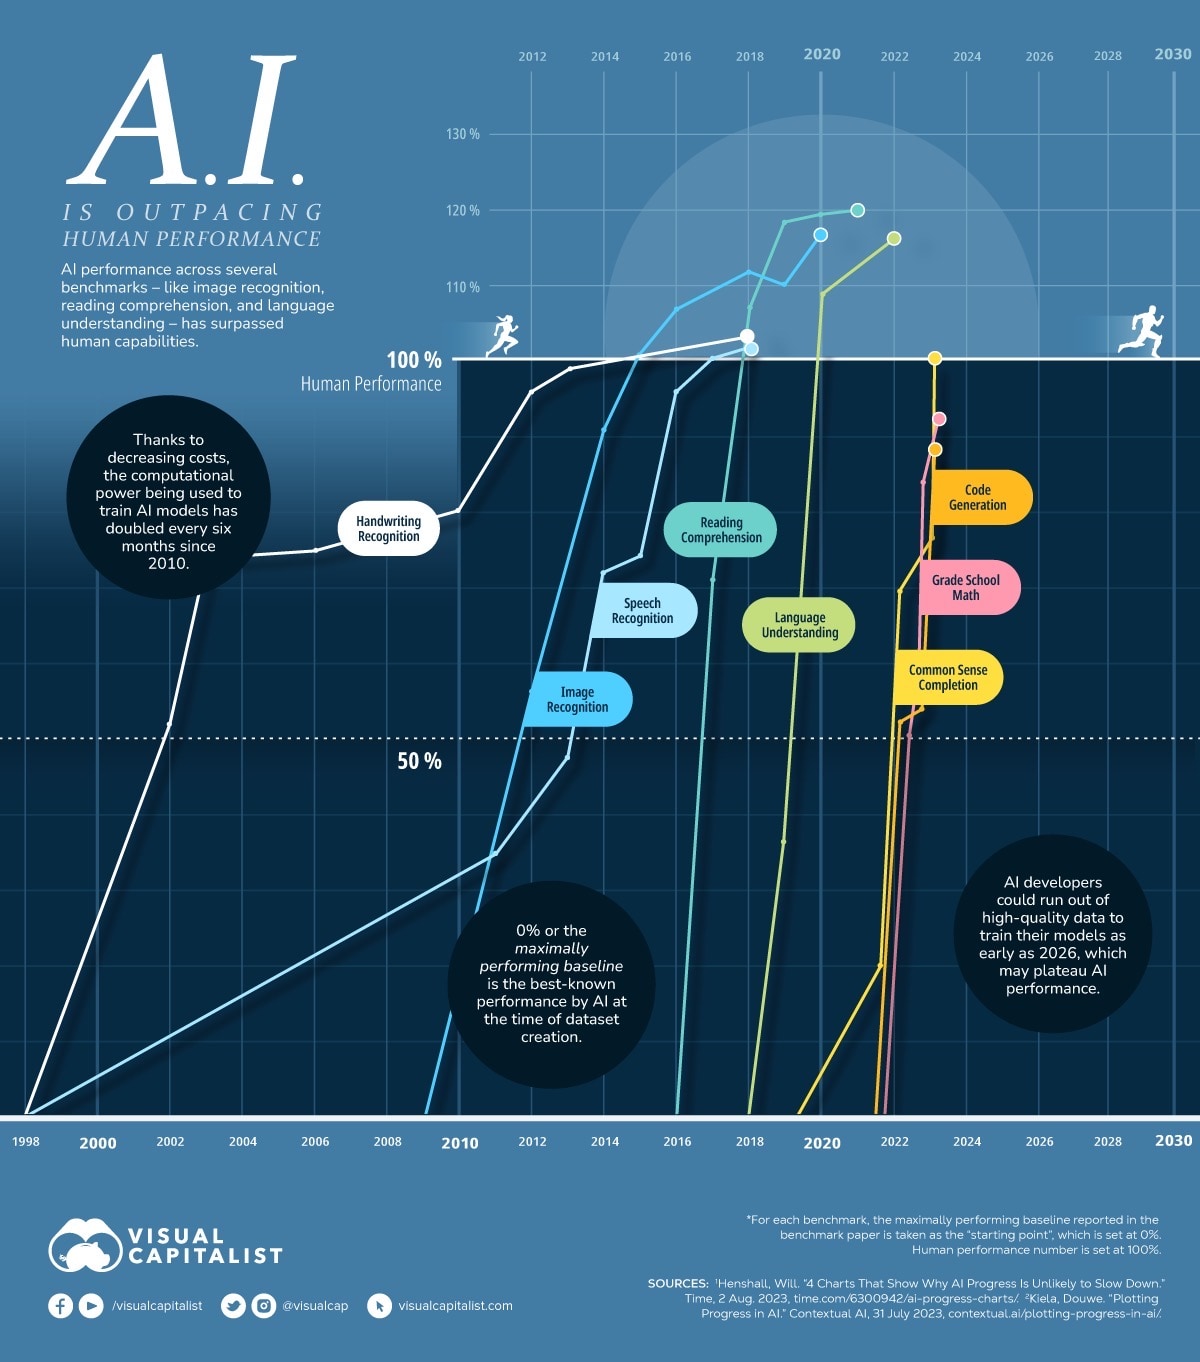
AI vs. human – which one is better in major benchmarks? (chart)
AI has surpassed humans in image recognition, reading comprehension, handwriting recognition, language understanding, and speech recognition.
-

9 things artificial intelligence cannot do for researchers
Is artificial intelligence a reliable companion in scientific research? The article from Enago Academy proves it’s not.
-
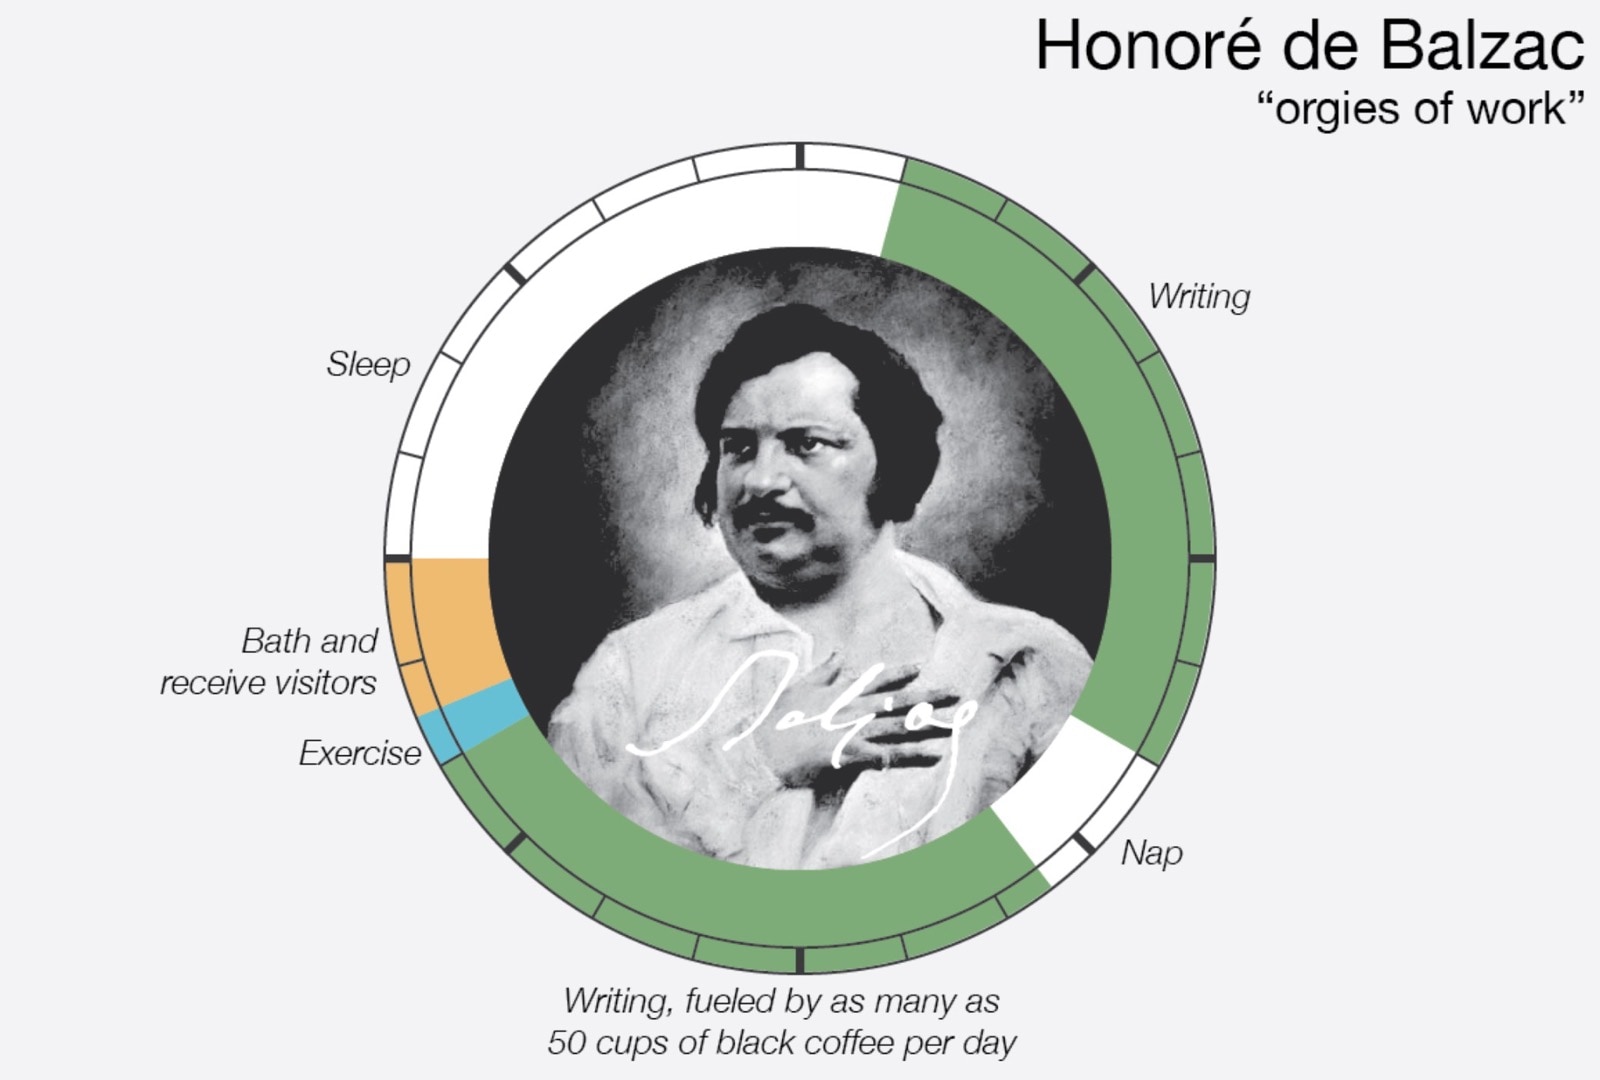
Inspiring daily routines of the famous creative minds (infographic)
This detailed chart compares the daily routines of the world’s most creative minds, including Charles Dickens, Maya Angelou, and Thomas Mann.
-
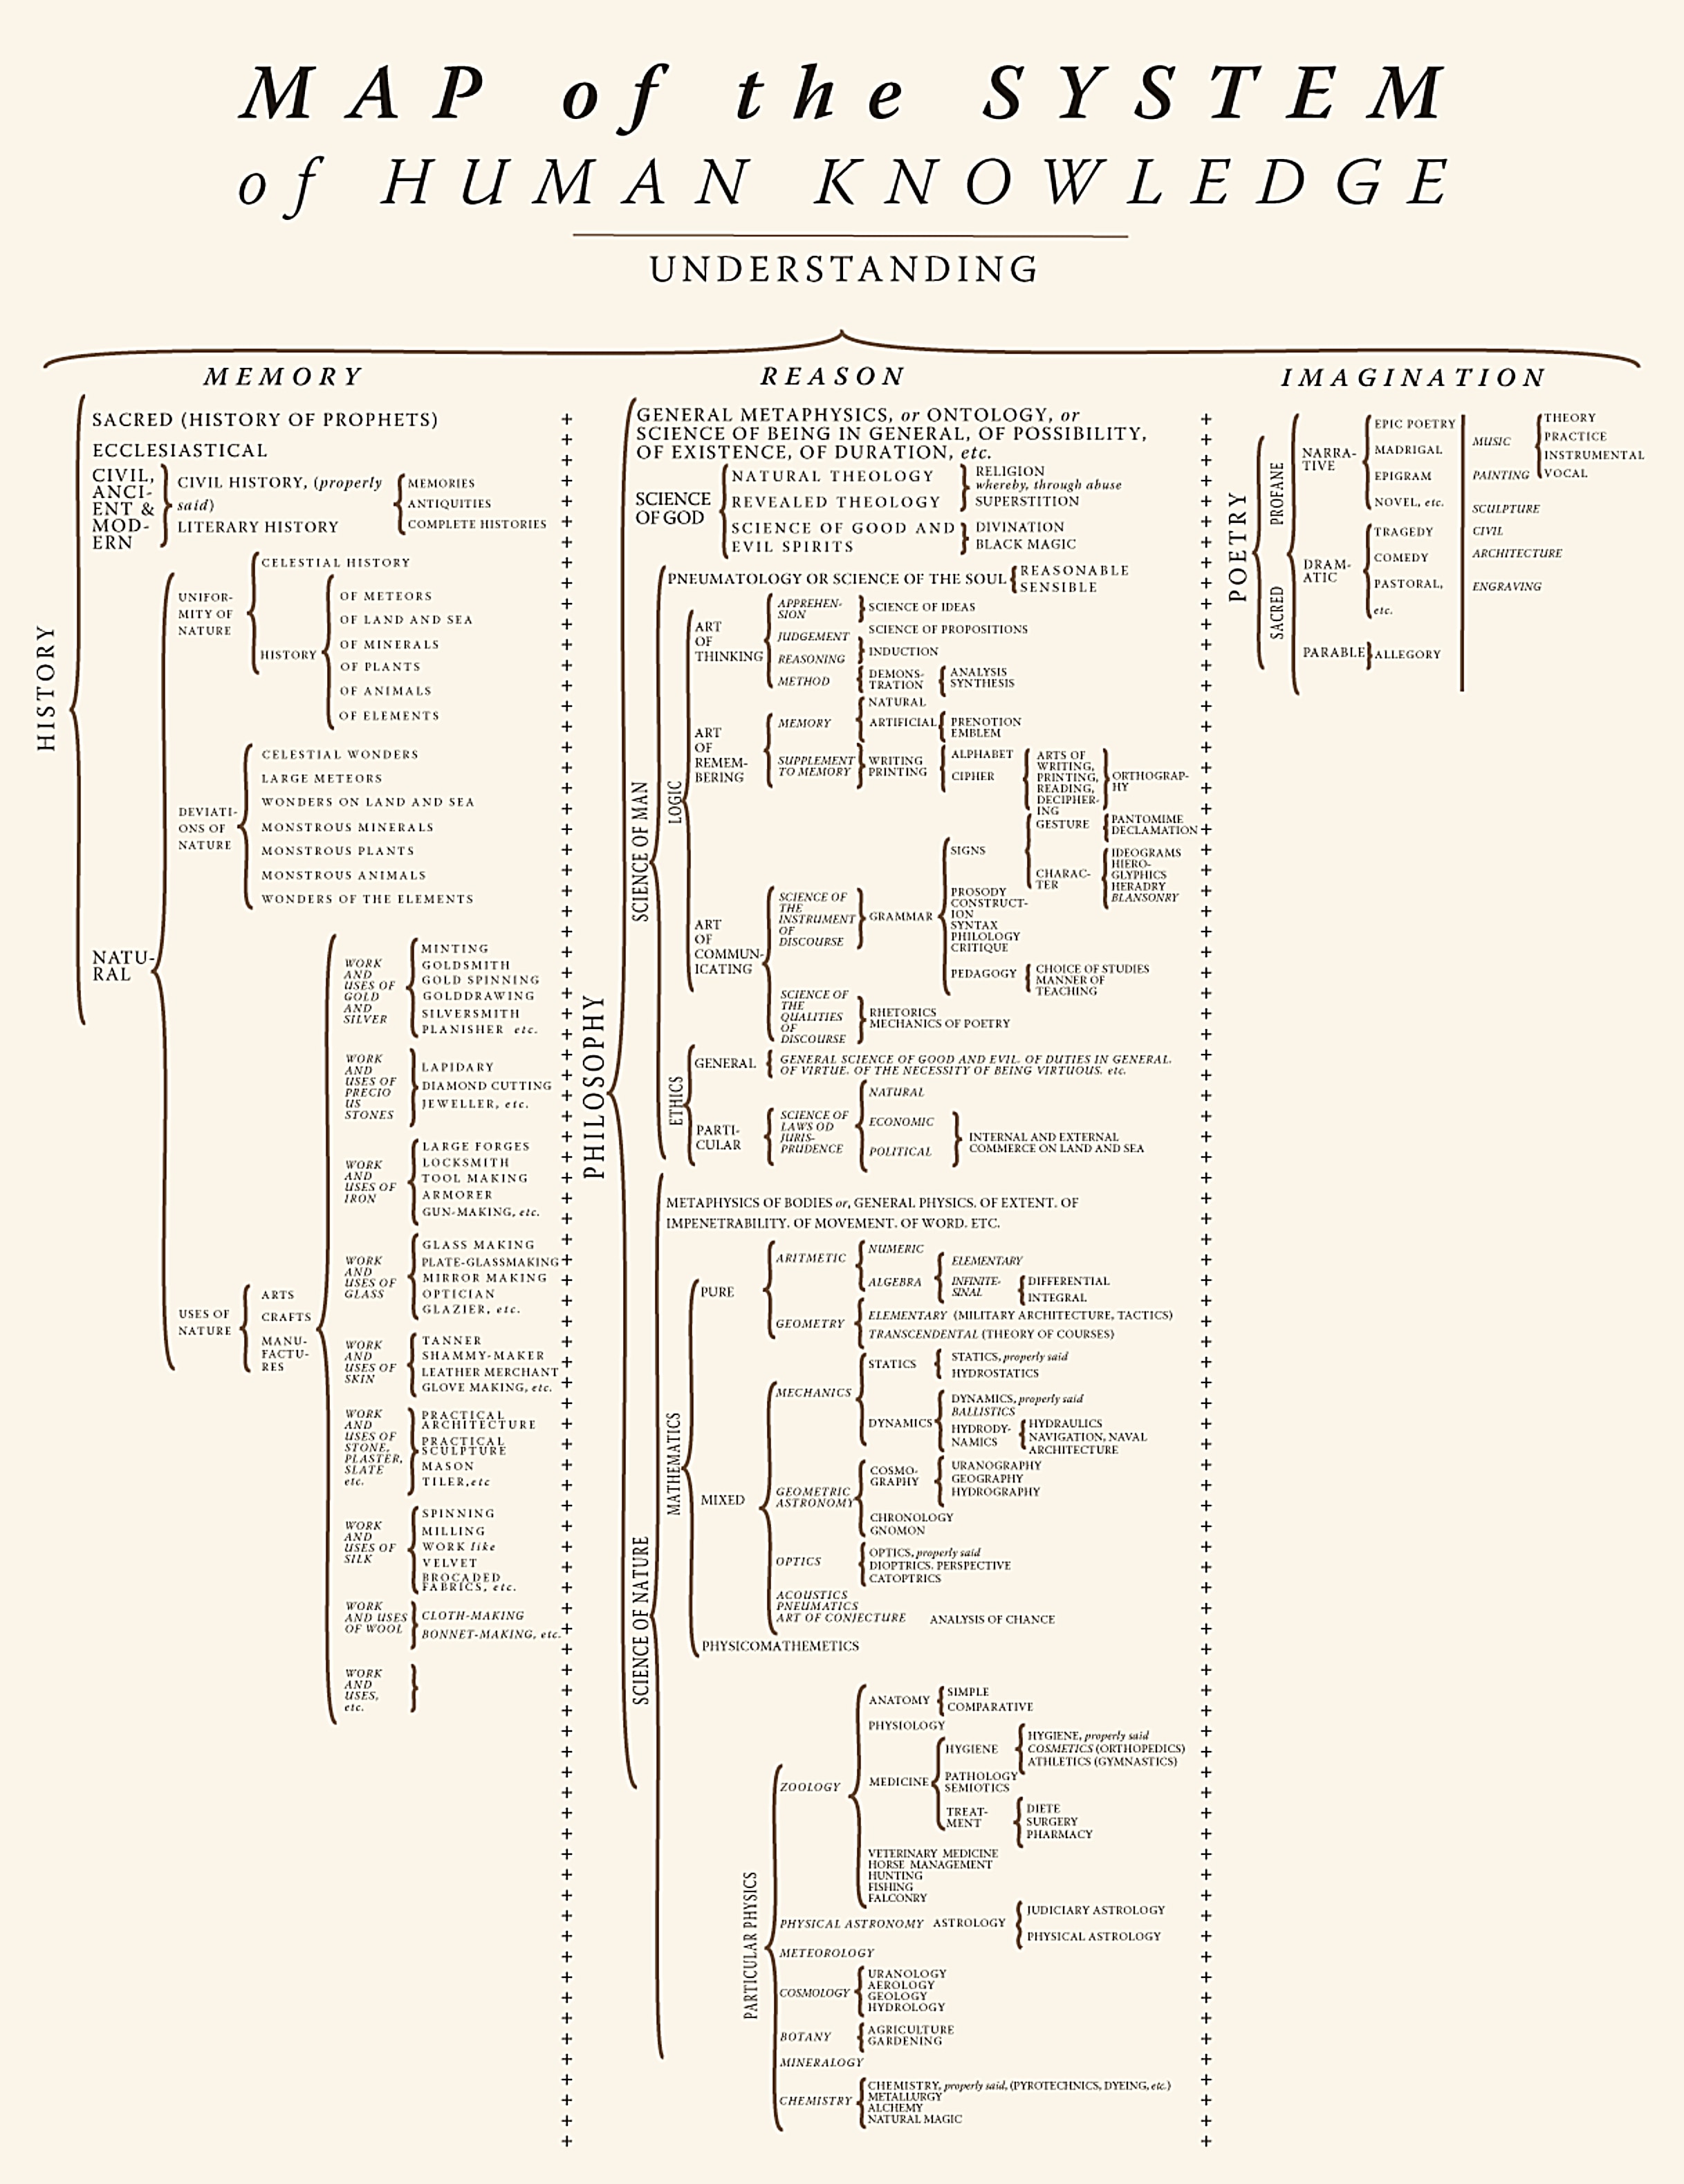
The classic map of human knowledge (English edition)
Known as the tree of Diderot and d’Alembert, it is a detailed classification chart that represents the structure of knowledge itself.
-
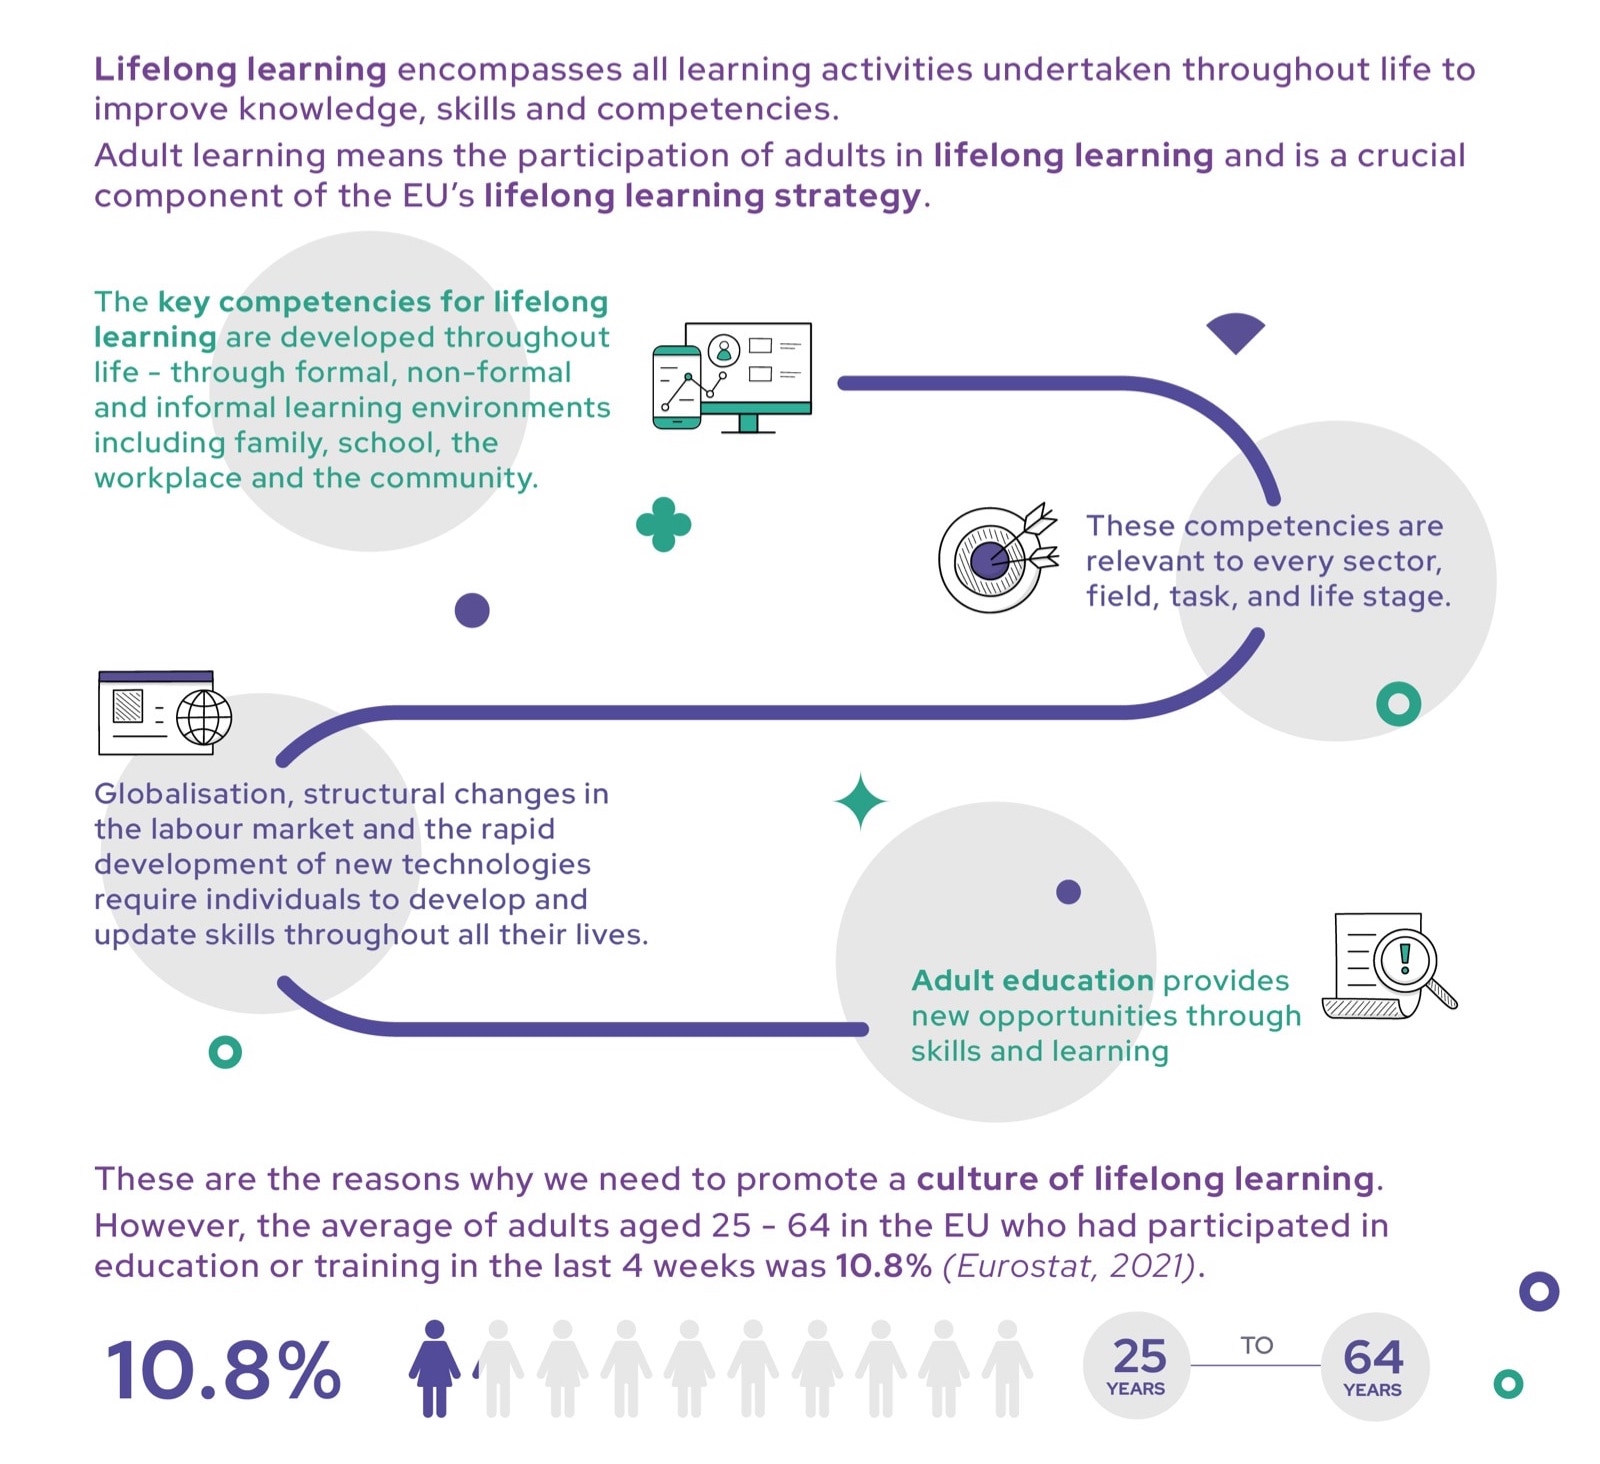
The benefits of a lifelong learning approach to skills (infographic)
Lifelong learning is the process of learning throughout one’s life. It includes all learning activities that are undertaken to improve knowledge, skills, and competencies.
-

Zazzle runs a massive Black Friday in July sale, with prices slashed even by 50%!
Today and tomorrow, you can save up to 50% on everything: invitations, mugs, tote bags, t-shirts, iPhone cases, notebooks, school supplies, and more.
-

Industries with the highest potential for AI (infographic)
Top 3 industries that are most prone to AI automation are: office support, legal, and engineering.
-

14 fun facts about microlearning (infographic)
Microlearning focuses on breaking down information into concise and easily digestible chunks, typically ranging from a few minutes to 15 minutes.
-
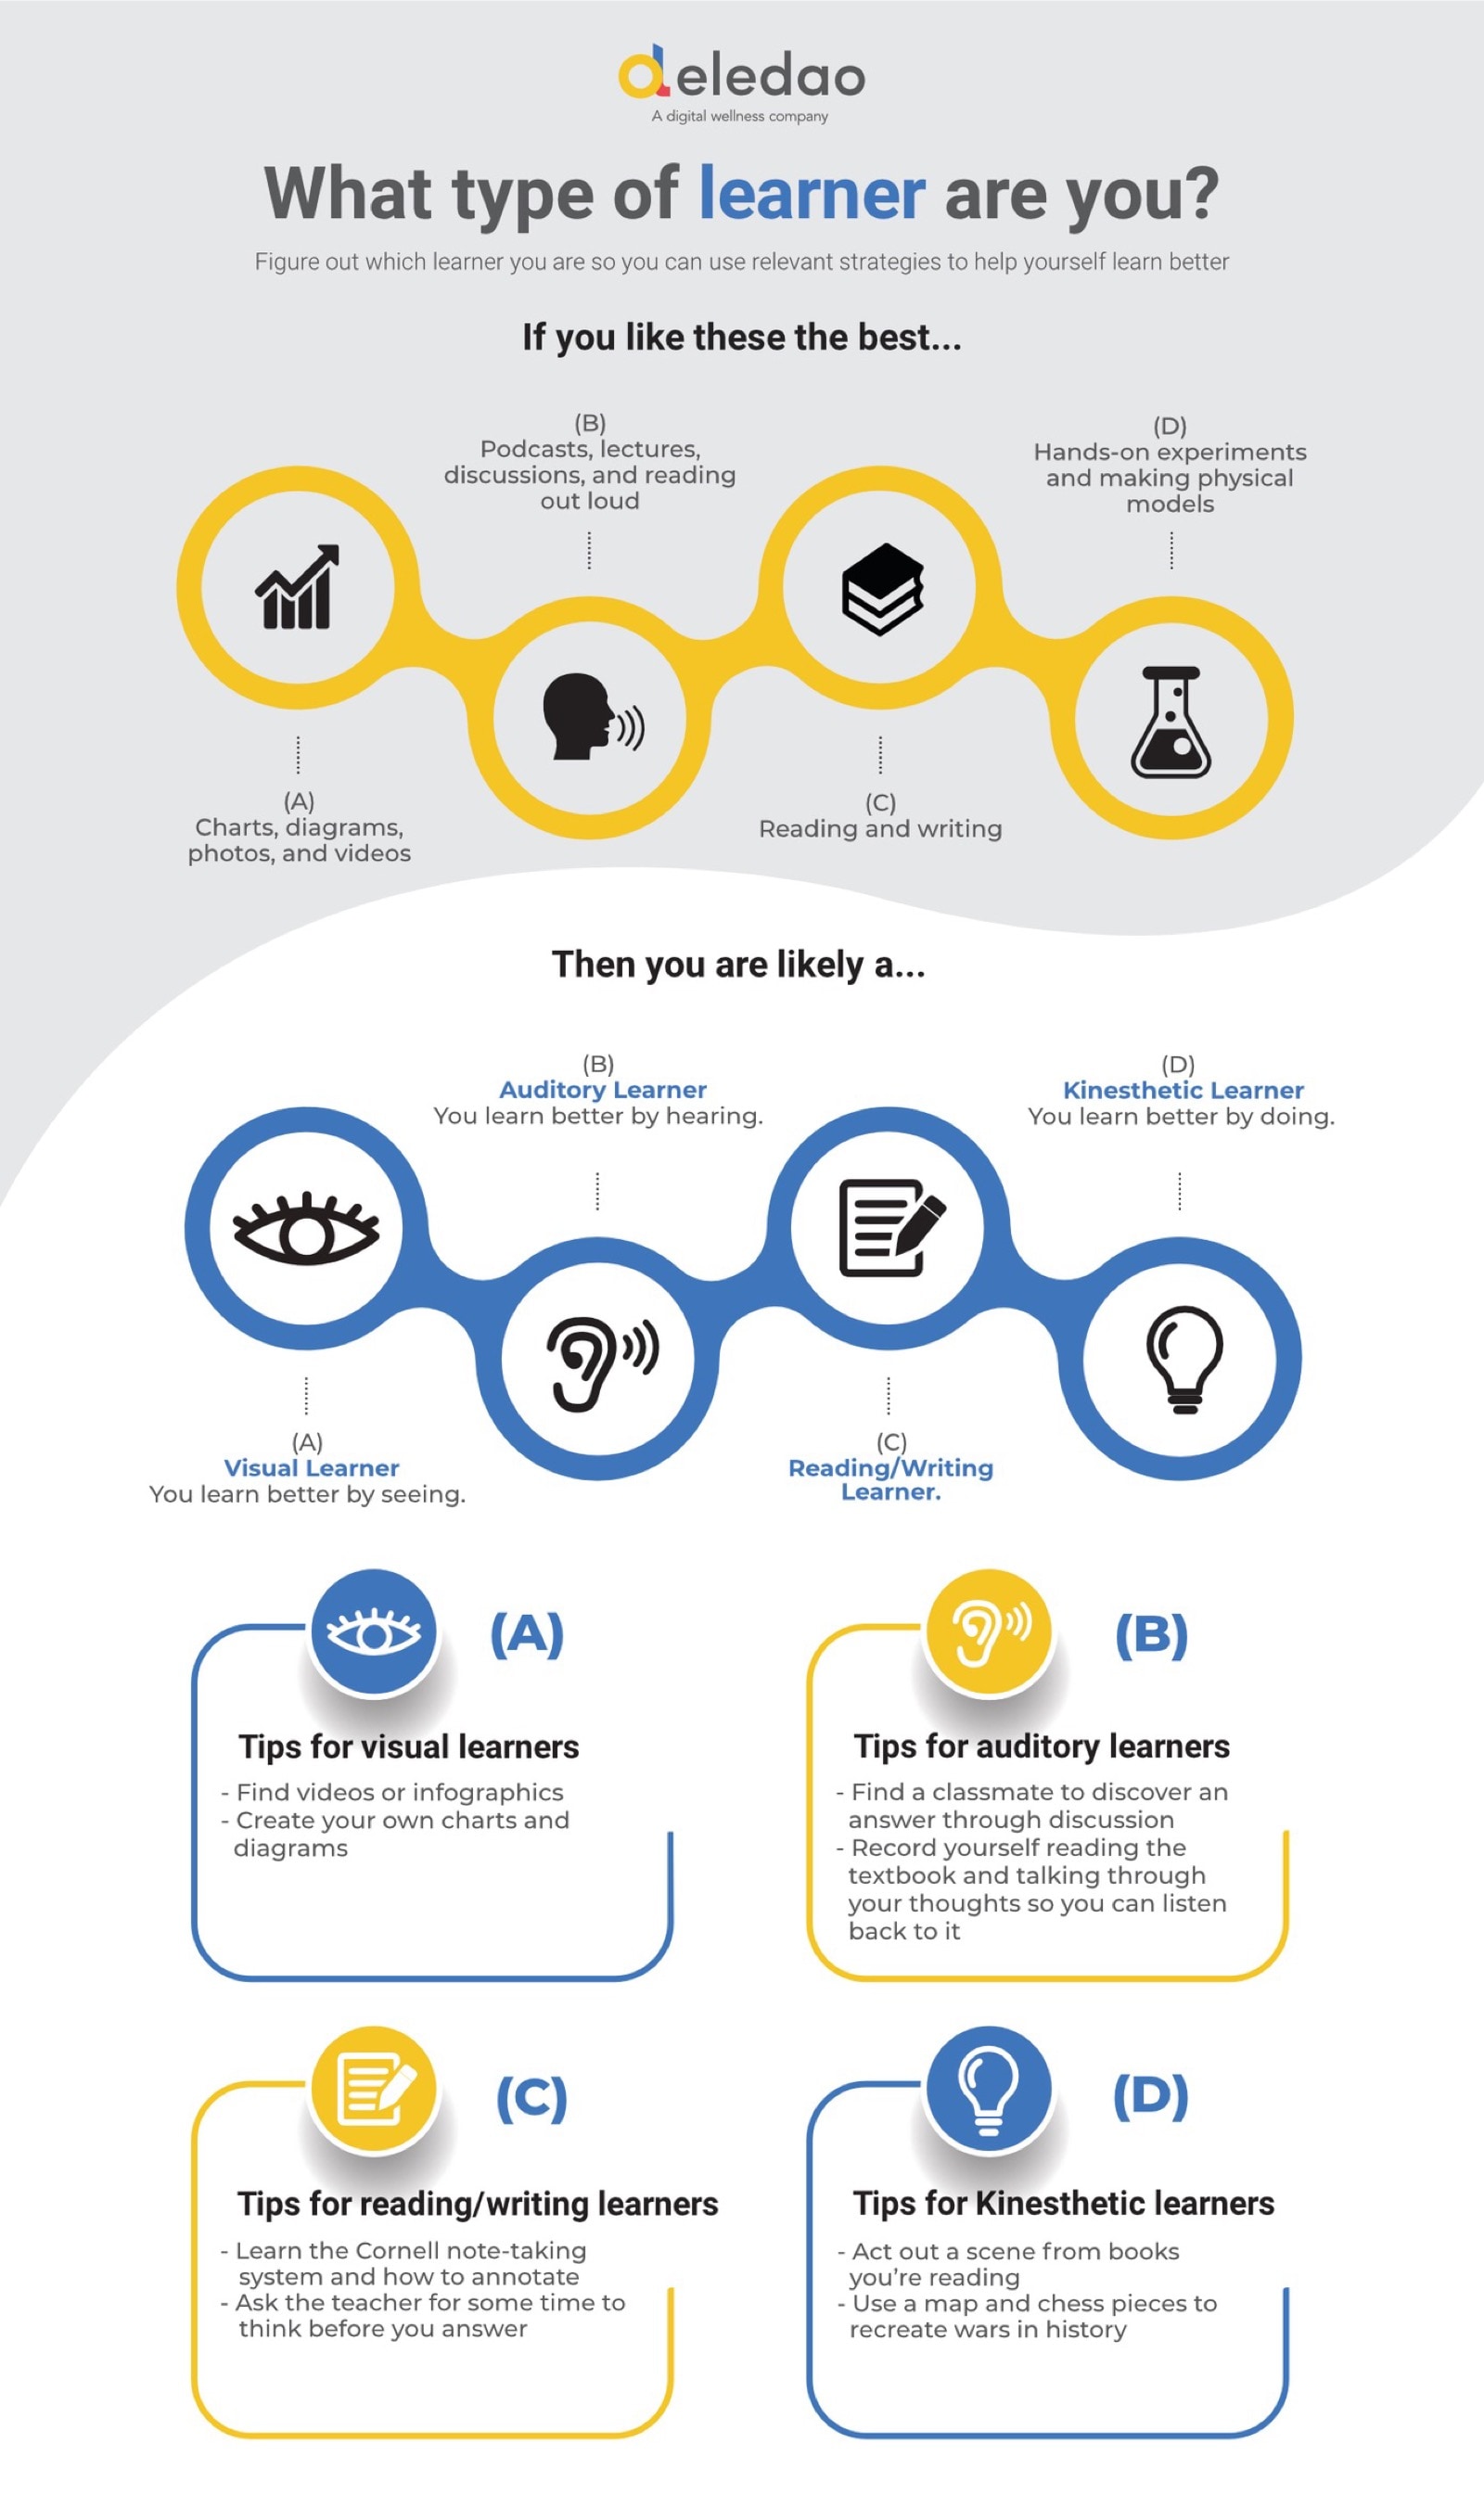
What type of learner are you? (infographic)
Once you find out what type of learner you are, you can start using relevant strategies to help yourself learn better and faster.
-
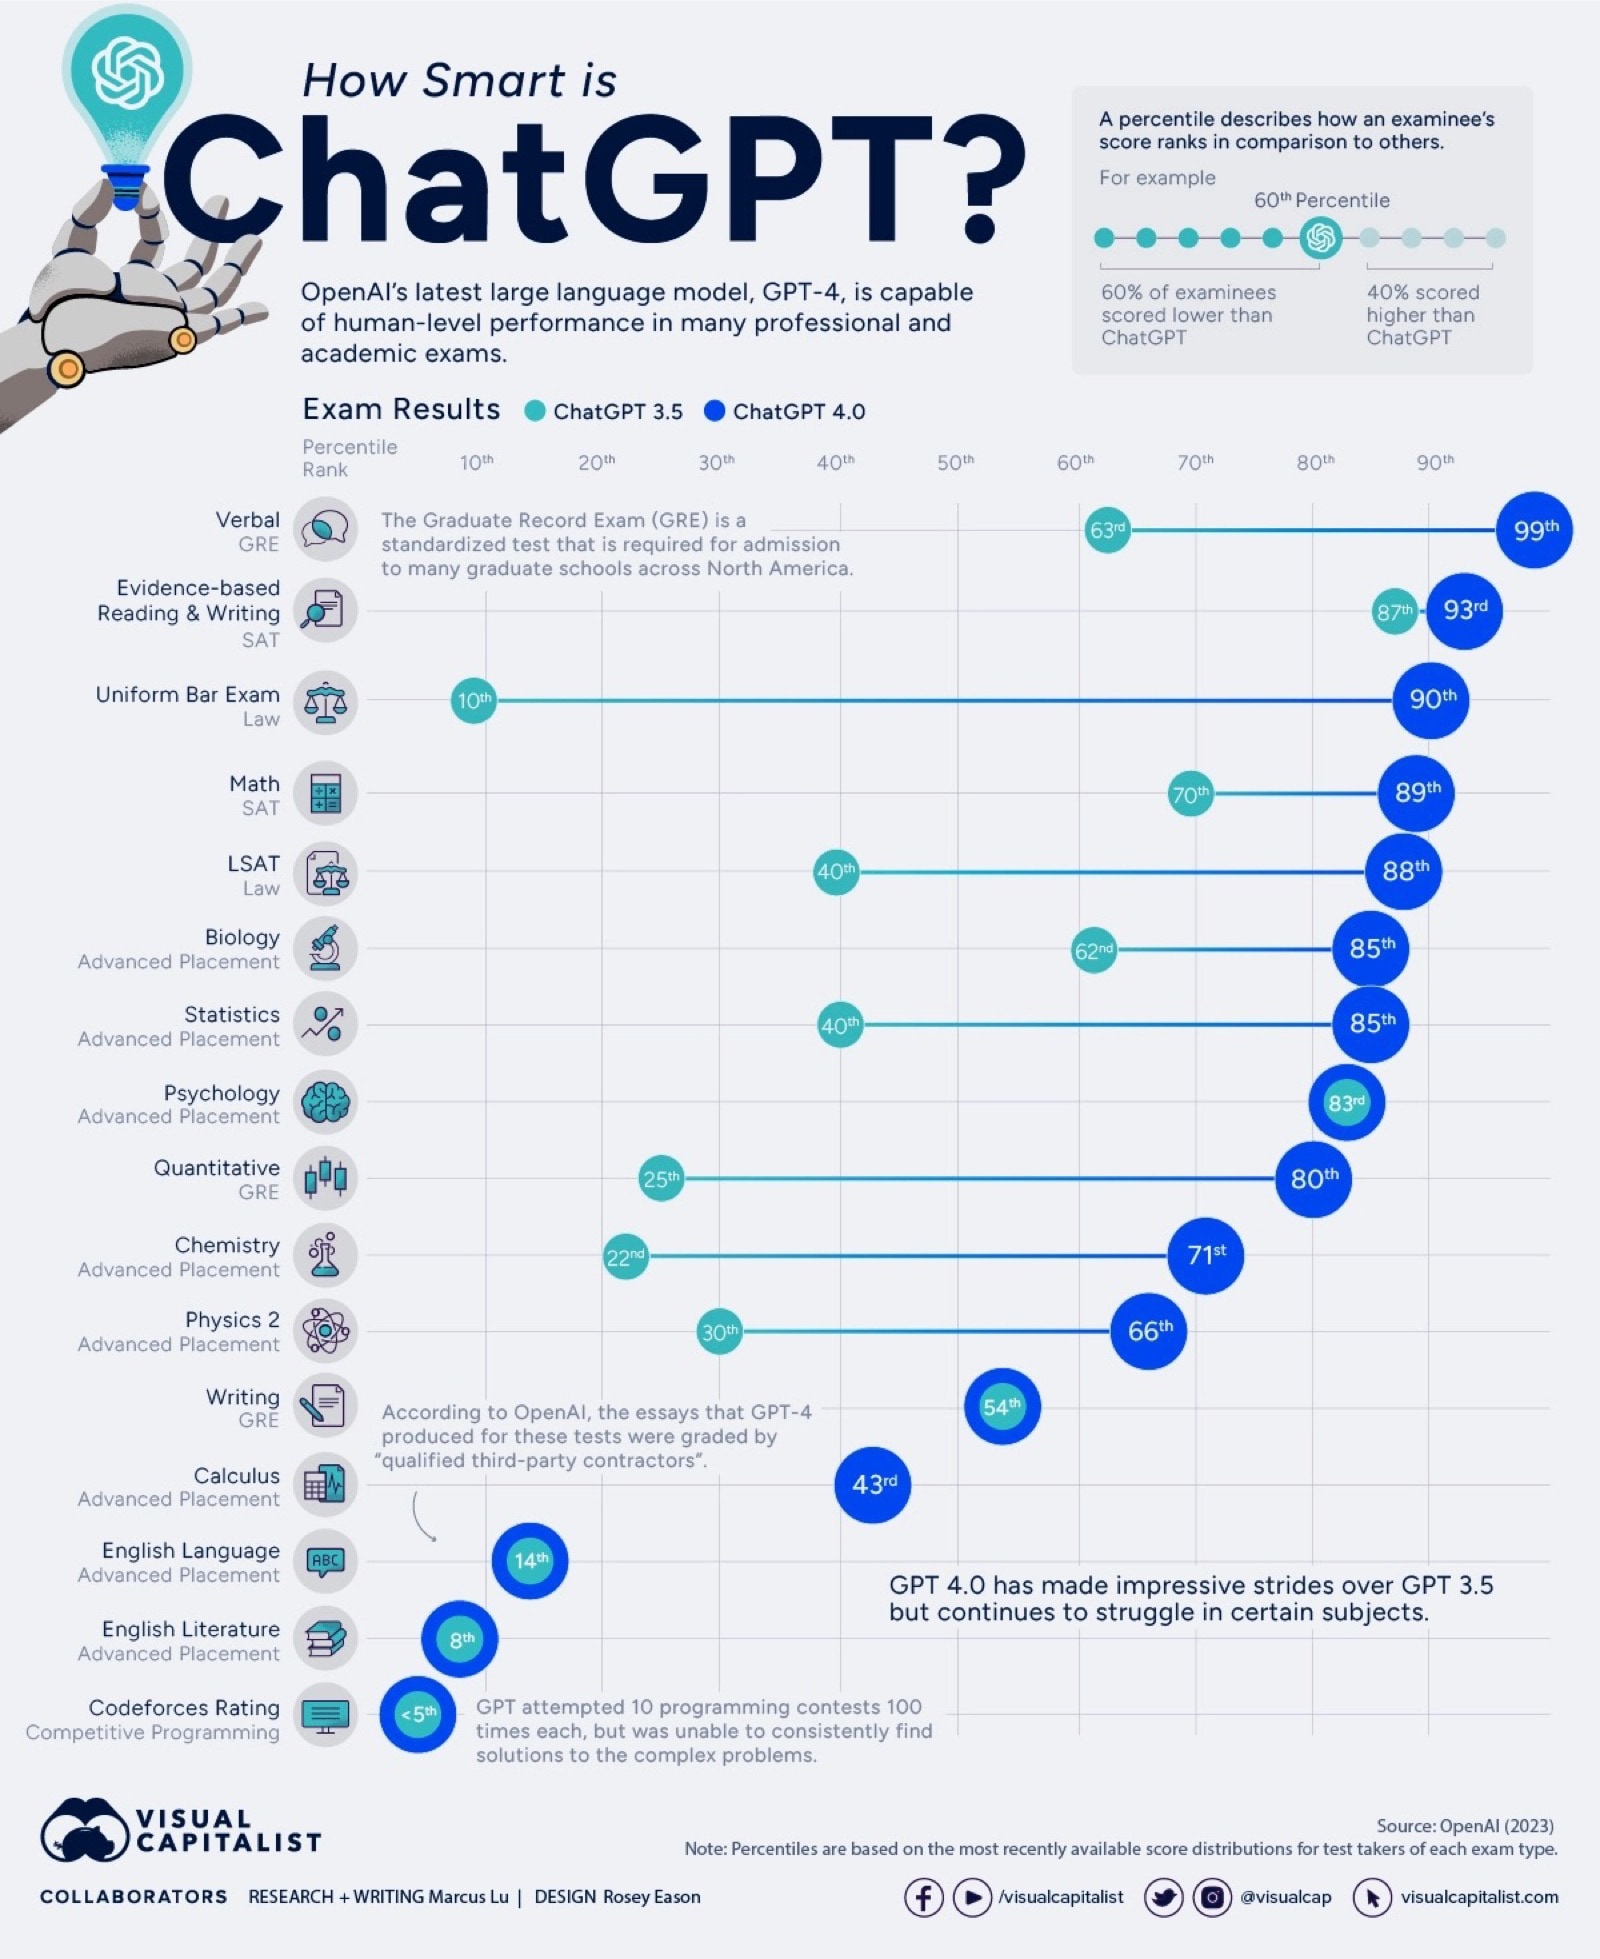
Artificial intelligence vs. humans in academic exams (infographic)
Artificial intelligence is now capable of human-level performance in many professional and academic exams.
-
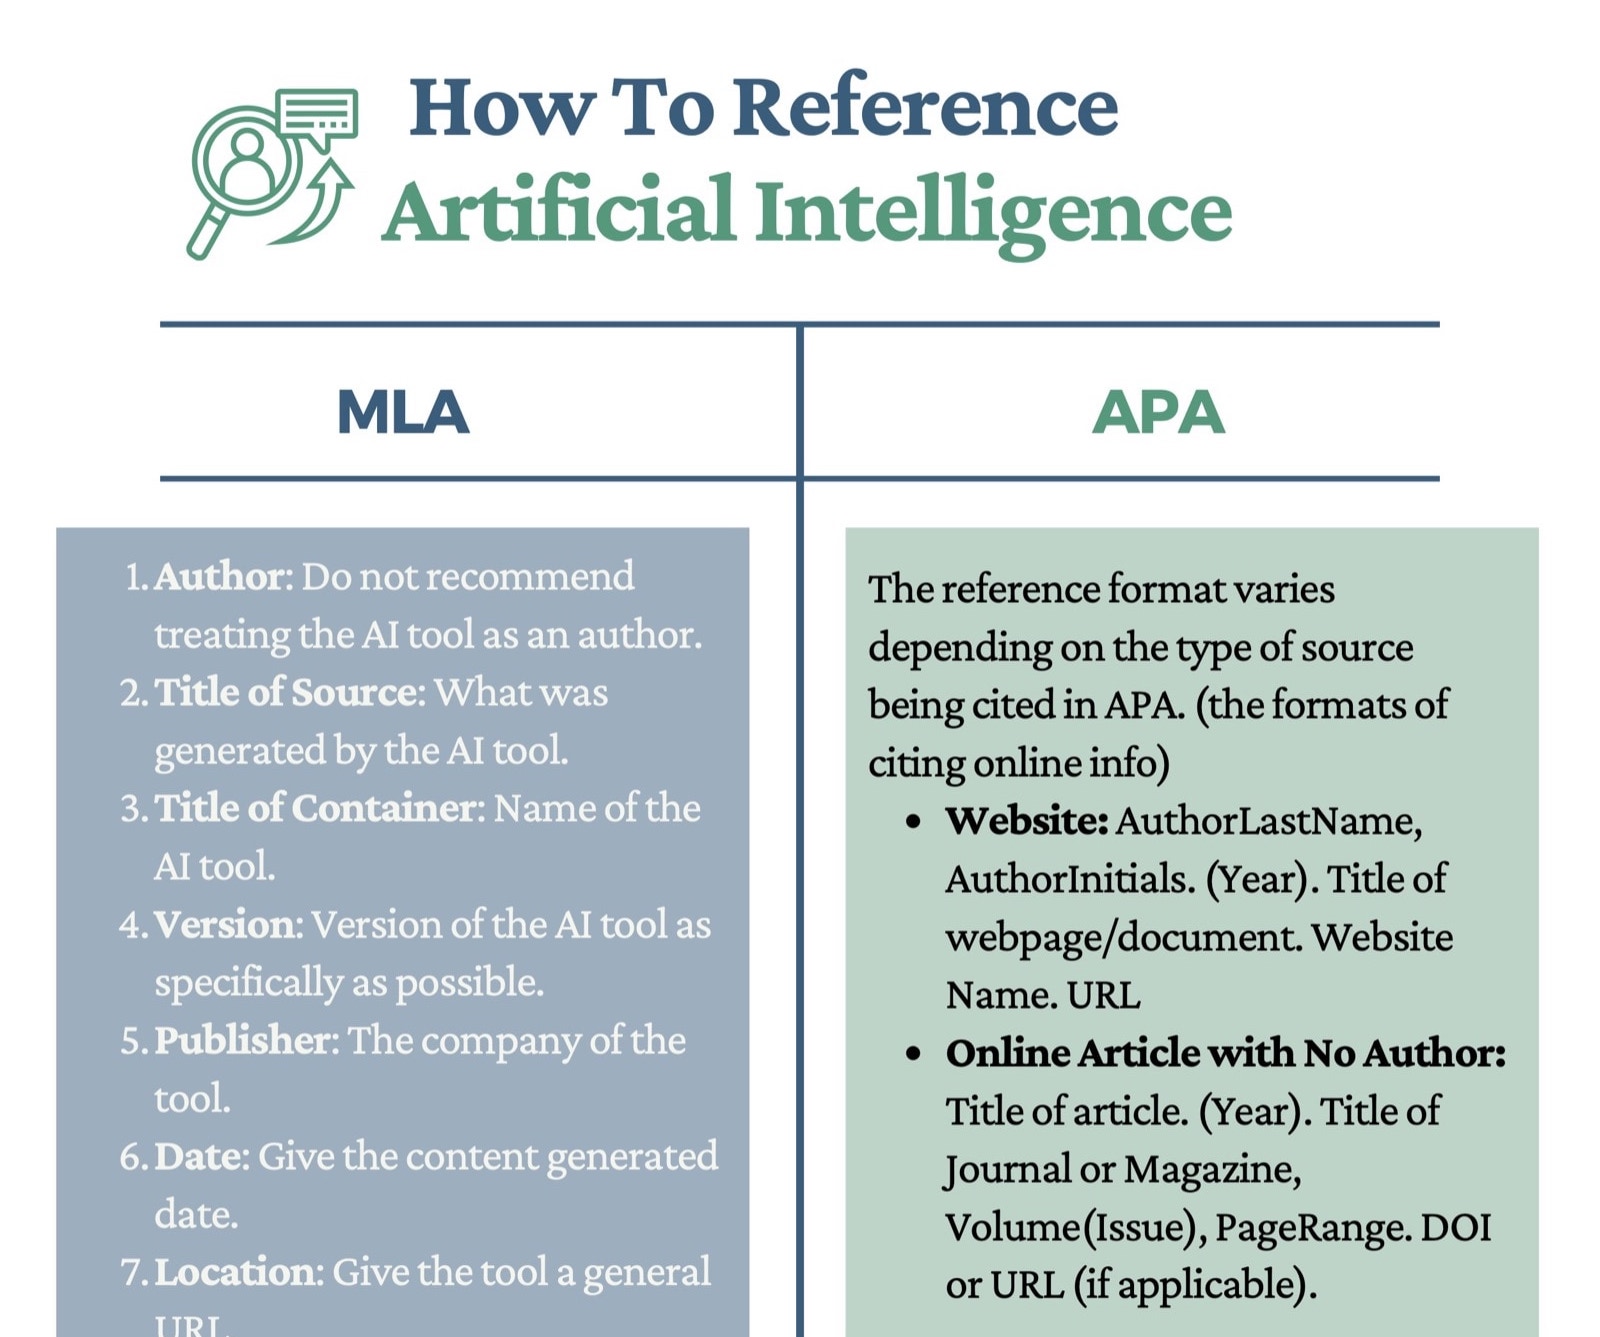
How to reference artificial intelligence (infographic)
With the growing popularity of artificial intelligence, it becomes essential to properly cite it. Here are helpful citation guidelines in MLA and APA styles.
-
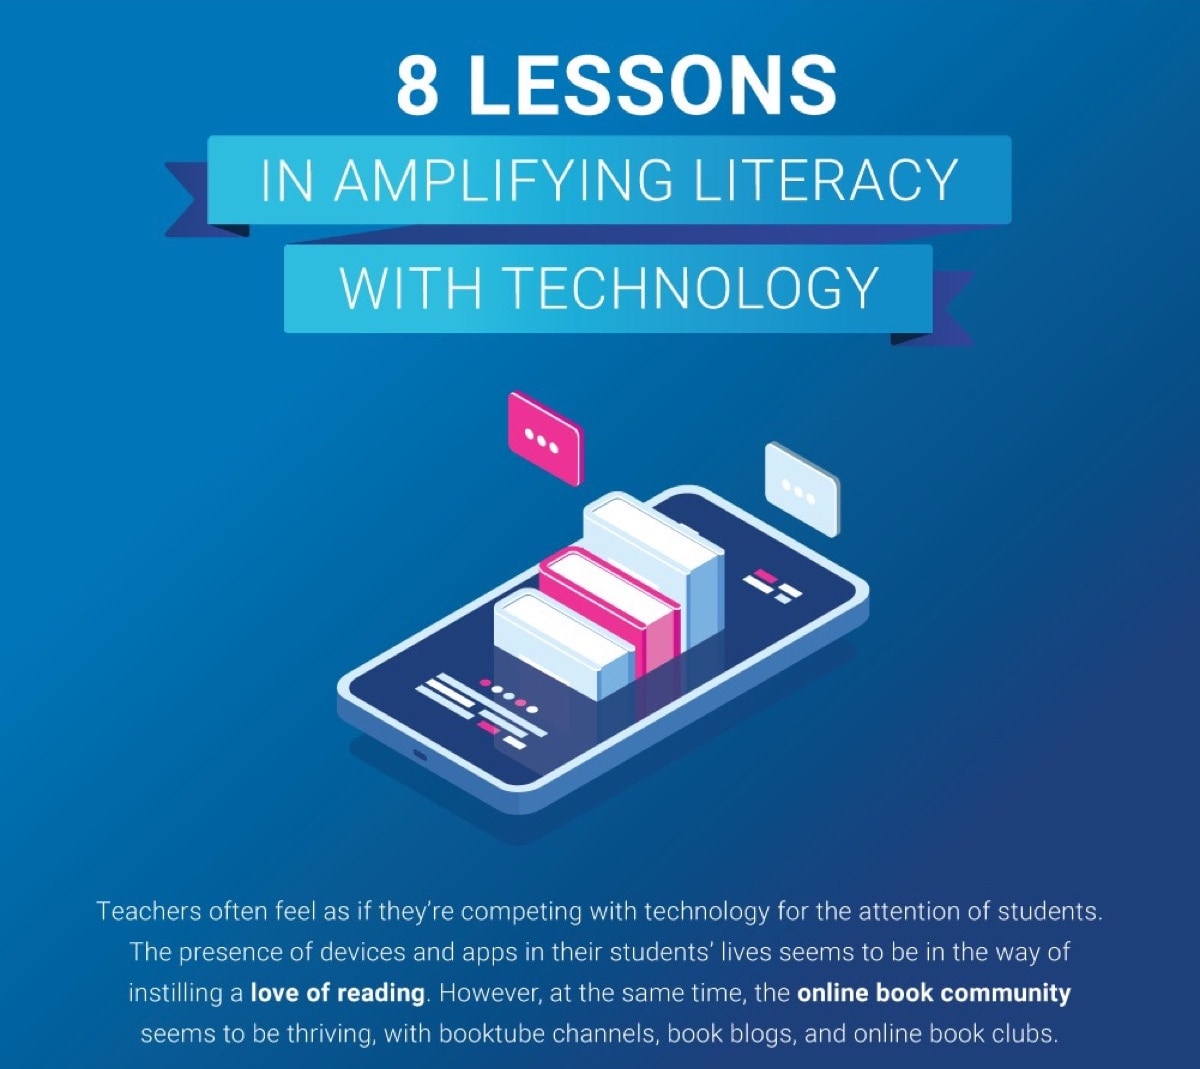
How to amplify literacy with technology (infographic)
With the right tools and strategies, teachers and students can maximize their literacy skills and better prepare themselves for the 21st century.
-

How to create a perfect author website (infographic)
Author websites can be used to establish credibility and as a hub for professional activities, both online and in real life.
-

8 quick tips to make your writing more efficient (infographic)
It’s possible to become a more efficient writer and make your work more enjoyable, without going through frustration, writer’s block, and moments of despair.
-

Five trends that are helping data storytelling grow (infographic)
Information overload, moving beyond text, democratization of content creation are fueling the rise of data storytelling
-
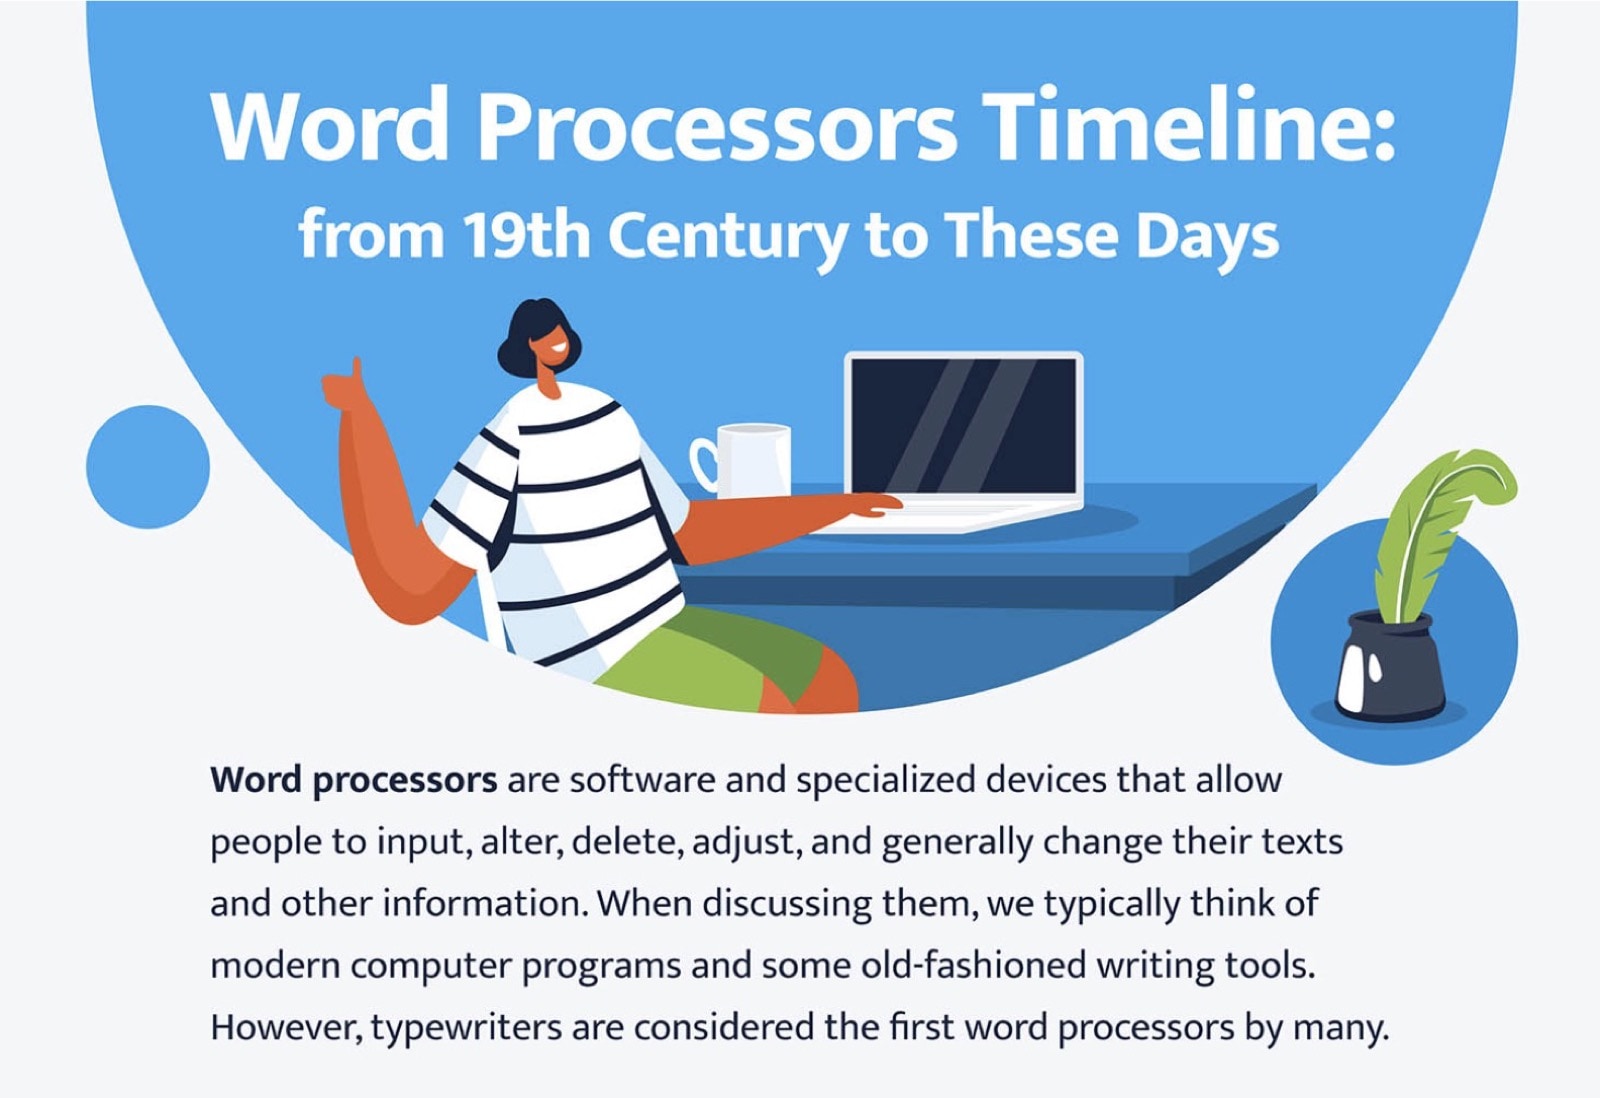
The history of word processors before Google Docs (infographic)
Nowadays, with the user-friendly software such as Google Docs, MS Word, or Apple Pages, the primitive word processors with their clumsy interfaces and restricted functionalities would be met with shock.
You must be logged in to post a comment.